From the community to policymakers to funding agencies, many types of audiences benefit from seeing a clear snapshot of a country’s progress to control tuberculosis (TB). That’s why the TB Data, Impact Assessment and Communications Hub (TB DIAH) project features a website with interactive, downloadable TB data visualizations.
TB DIAH is funded by the United States Agency for International Development (USAID) and is part of the agency’s Global Accelerator to End Tuberculosis. TB DIAH is meant to ensure optimal demand for and analysis of TB data and the appropriate use of that information to measure performance and inform decision making to end TB.
The project has created a website that features a data hub and a collection of useful TB-related materials, including a curated list of the latest TB reports, research, and news. The data hub has summary and country-level data dashboards, offering visualizations for 23 USAID priority countries that have high burdens of TB.
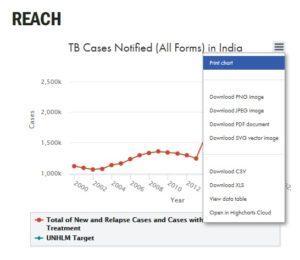
The data hub dashboards were recently updated to reflect the data included in the World Health Organization’s 2018 Global Tuberculosis Report. The visualizations feature scatter plots, bar graphs, pie charts, and line graphs. Each visualization shows a country’s progress measured against the targets set by the United Nations High-Level Meeting on the Fight to End Tuberculosis. Variables in the data visualizations are interactive: that is, they can be turned off or on to provide nuanced information. For example, pediatric TB cases are shown by gender, but hub users can turn off the number of male cases, thereby gaining a clearer picture of the impact that TB has on female children.
Clicking on the three-line menu found in the upper right corner of each data visualization reveals a list of options for using the graphic. For example, it can be printed or the data table that produced the visualization can be accessed. Visitors also have the option of downloading the graphic as an image, document, or Excel file. This feature enriches the visualizations and makes it possible to share them with global and country-level audiences for decision making.
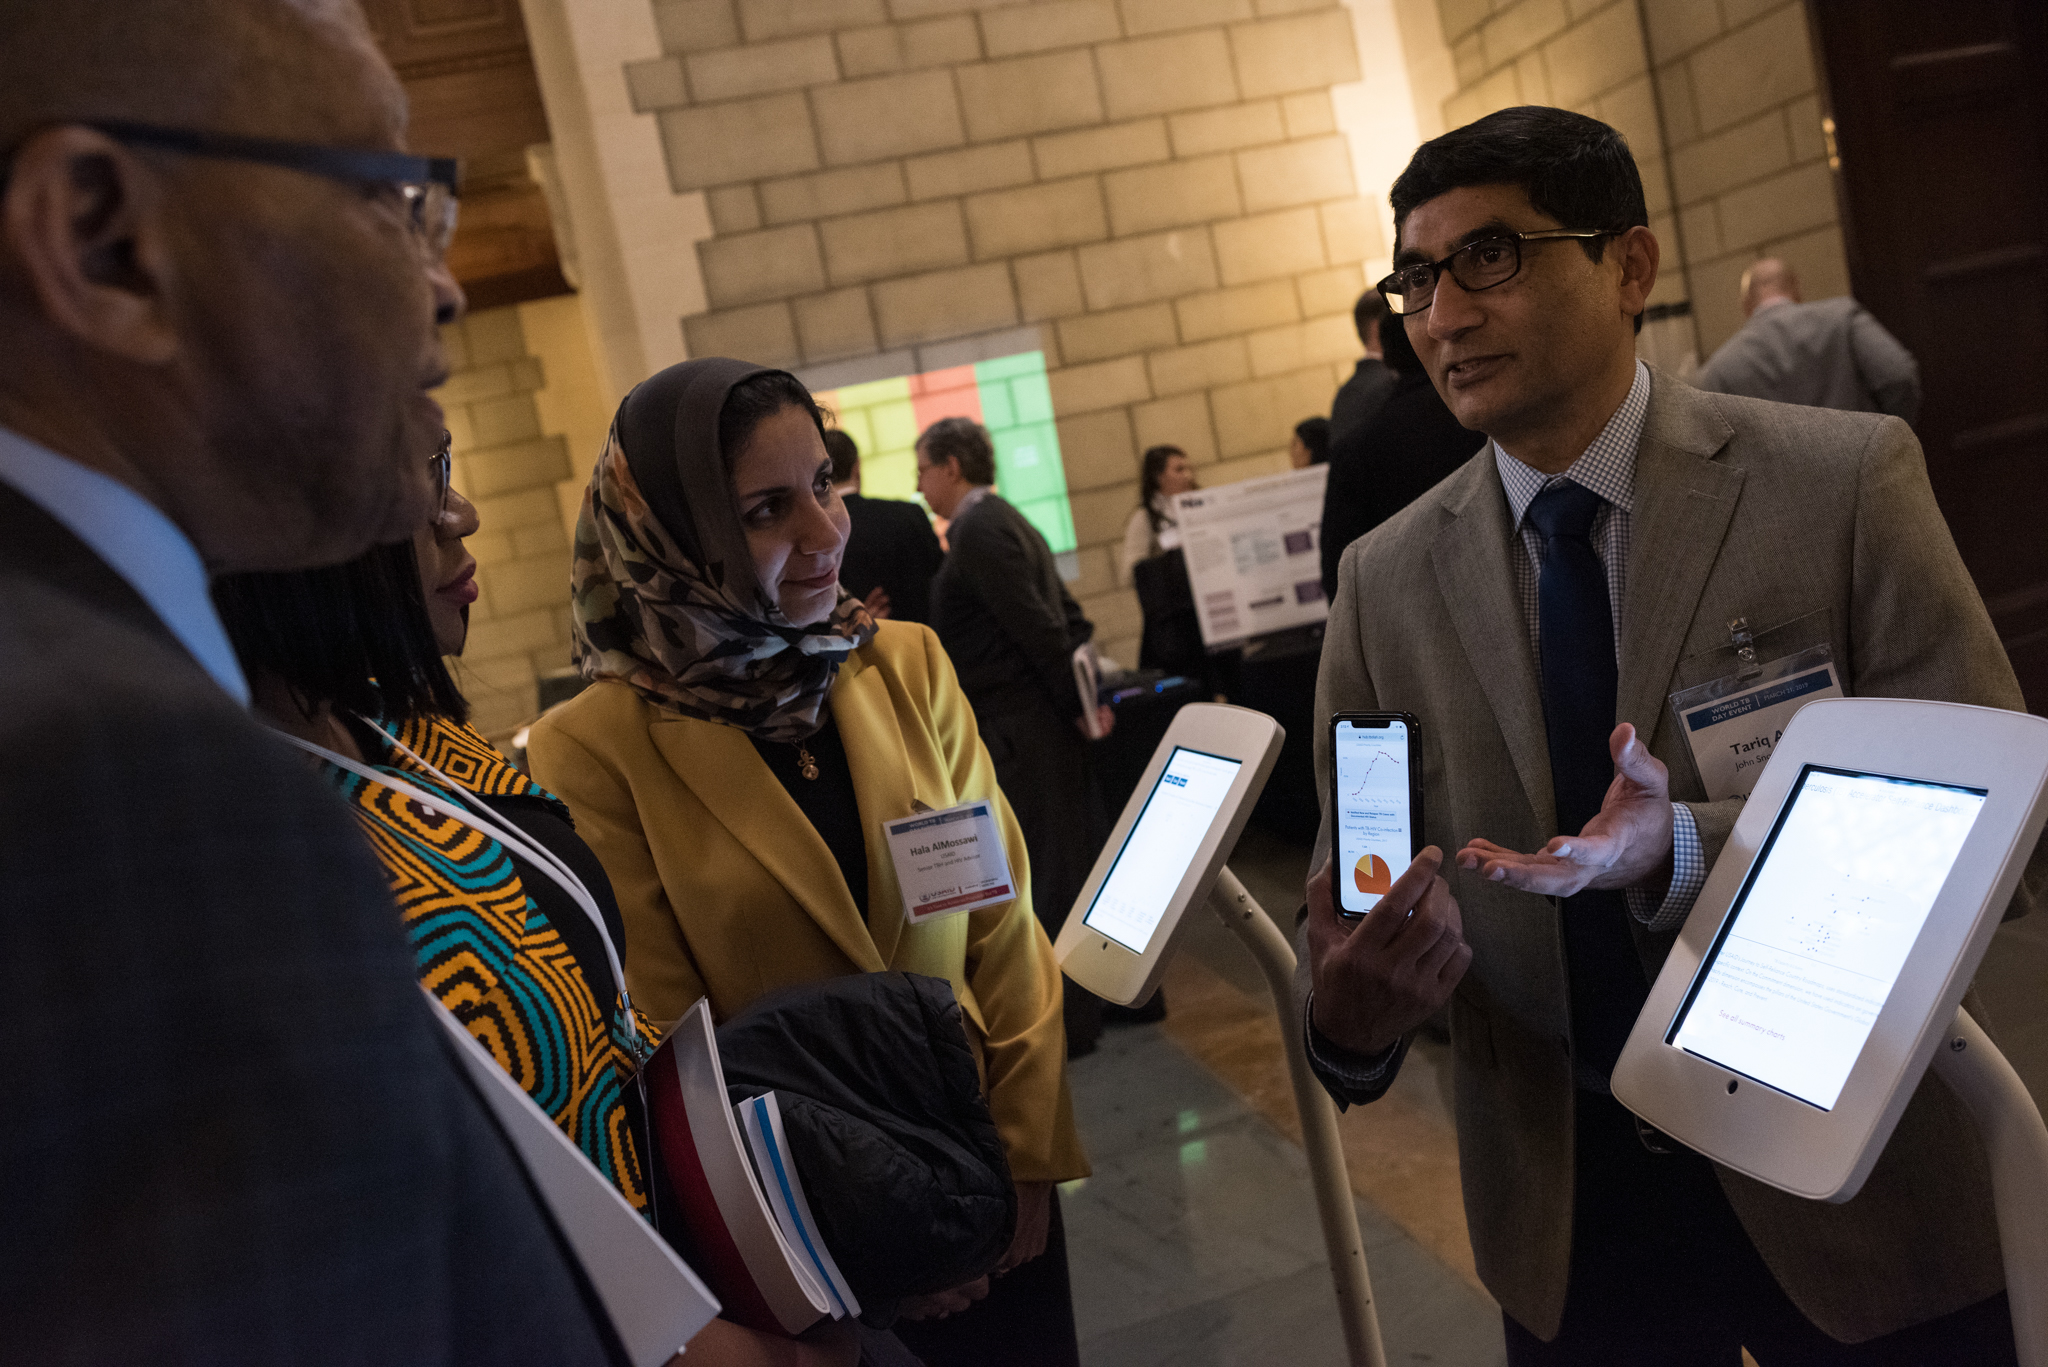
“We designed the data hub to be interactive and provide a useful resource to global and country-level TB stakeholders,” said Tariq Azim, MBBS, DCM, TB DIAH’s senior monitoring and evaluation (M&E) technical advisor. “We want people to use these data visualizations to better understand tuberculosis, and to inform decisions and investments to end TB.”
Explore the data hub at https://hub.tbdiah.org/ and contact the TB DIAH team with any questions at hub@www.tbdiah.org.

