By Ersin Topcuoglu, MD, MPH, TB DIAH Project
 One goal of the TB Data, Impact Assessment and Communications Hub (TB DIAH) is to promote information use—specifically to ensure demand for and analysis of tuberculosis (TB) data to inform national TB programs and USAID interventions and policies. The data visualizations in the TB DIAH hub are designed to make it easy for program managers, civil society organizations, and decision makers working on TB to measure performance and support and facilitate accountable governance of TB programs.
A best practice in facilitating data analysis and use is the cascade method for finding gaps in programs. Cascades quantify, track, and visualize how health and development programs are performing for the target population at progressive stages toward an expected outcome. They reveal weaknesses at stages of TB control and help program and project managers recognize unacceptable variations among different disaggregation levels and refine targeted TB activities for implementation.
Disaggregation is one of the optional features available when designing a cascade, also known as a “care cascade” or a “service cascade.” Cascades can be used for an entire population or disaggregated at a subpopulation level (etc., by age, sex, geographic location, etc.) to better understand the effects of gaps across subpopulations at different program steps.
Generally, cascades are constructed in three steps:
- Design the cascade
- Collect data
- Analyze the data
Cascade analysis should lead to secondary data collection and analysis to dive deeper into the reasons and root causes behind these gaps. The main objective of cascade analysis is to measure gaps and missed opportunities to find and treat TB patients along the continuum of care. Understanding the reasons for the gaps will help one to identify missed opportunities such as these:
- Which TB services are performing less well than expected: diagnostic or treatment services?
- Are we missing certain target groups?
- Are we missing certain geographic areas?
- What other combinations of these gaps exist—not limited to the programmatic questions above?
Cascade analysis is not a panacea. Its limitations are lack of high-quality and complete data for every step, a lack of standard definitions for cascade steps, and possible overlaps in steps.
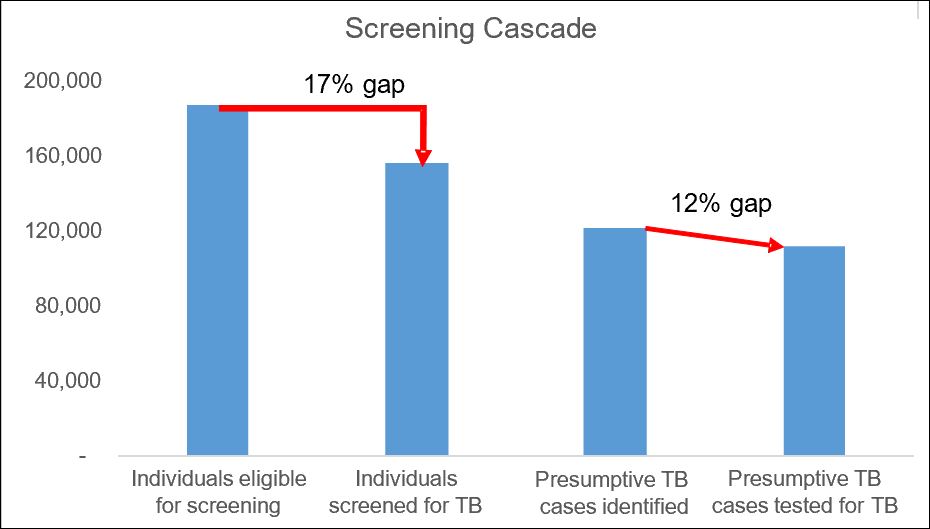
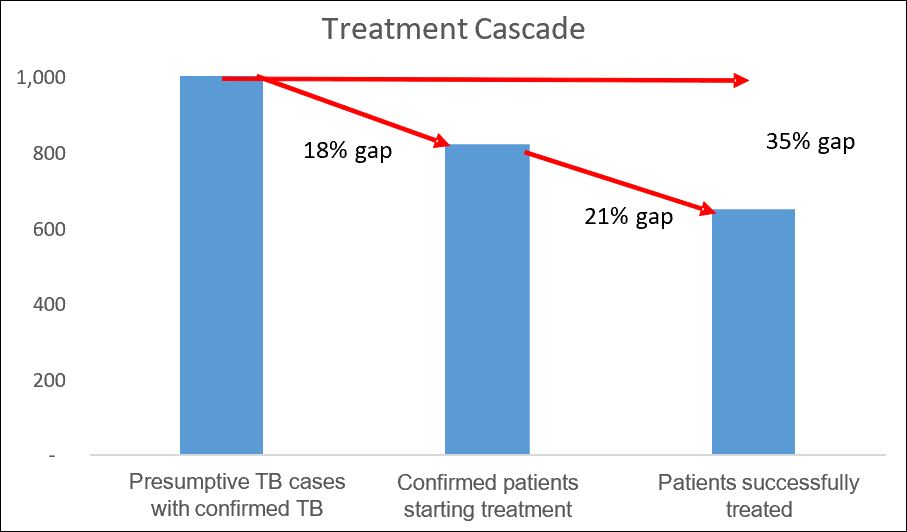
Below is a two-part example from a high-burden country using screening as the object of the cascade. You can see from the screening cascade figures that the screening intervention has failed to screen 31,000 eligible patients (a 17 percent gap). In addition, the system has failed to test 10,000 screened people (a 12 percent gap). The treatment cascade shows a 35 percent gap between patients diagnosed and patients successfully treated.


As you see, these data show only what and where the problems or gaps are. The cascade data do not tell us why these gaps exist. Cascade data analysis should lead to additional data collection and analysis to further explain the reasons for the gaps. This is important for implementing targeted interventions and directing limited resources more precisely for maximum performance.
Suggested Reading
Subbaraman R, Nathavitharana RR, Mayer KH, Satyanarayana S, Chadha VK, Arinaminpathy N, et al. (2019). Constructing care cascades for active tuberculosis: A strategy for program monitoring and identifying gaps in quality of care. PLoS Med 16(2): e1002754. https://doi.org/10.1371/journal.pmed.1002754. Published: February 27, 2019
The cascade of care (also called the continuum of care) is a useful model for evaluating patient retention across sequential stages of care required to achieve a successful outcome. The cascade helps to quantify gaps in care delivery, pointing to areas in which quality of care could be improved.
Yuen CM, Millones AK, Contreras CC, Lecca L, Becerra MC, Keshavjee S (2019). Tuberculosis household accompaniment to improve the contact management cascade: A prospective cohort study. PLoS ONE 14(5):e0217104. https://doi.org/10.1371/journal.pone.0217104. Published: May 17, 2019
This prospective cohort study of household contacts of tuberculosis patients who initiated treatment during September 2015–June 2016 in Lima, Peru, sought to determine whether a community-based accompaniment intervention could improve TB contact management.
Jagger A, Reiter-Karam S, Hamada Y, Getahun H (2018). National policies on the management of latent tuberculosis infection: review of 98 countries. Bull World Health Org 96:173-184F. http://dx.doi.org/10.2471/BLT.17.199414. Published: February 5, 2018
The authors reviewed policies on management of latent TB infection in countries with low and high burdens of the disease, focusing on policy gaps and deviations from World Health Organization policy recommendations.
Hanson CL, Mike Osberg M, Brown J, Durham G, and Chi DP (2017). Conducting Patient-Pathway Analysis to Inform Programming of Tuberculosis Services: Methods. JID 2017:216 (Suppl 7). https://doi.org/10.1093/infdis/jix387. Published: November 6, 2017
The patient-pathway analysis (PPA) method detailed in this article was developed to show more clearly the alignment between patient care seeking and TB service availability.
Click here to subscribe to the TB DIAH Digest and other project materials.

